
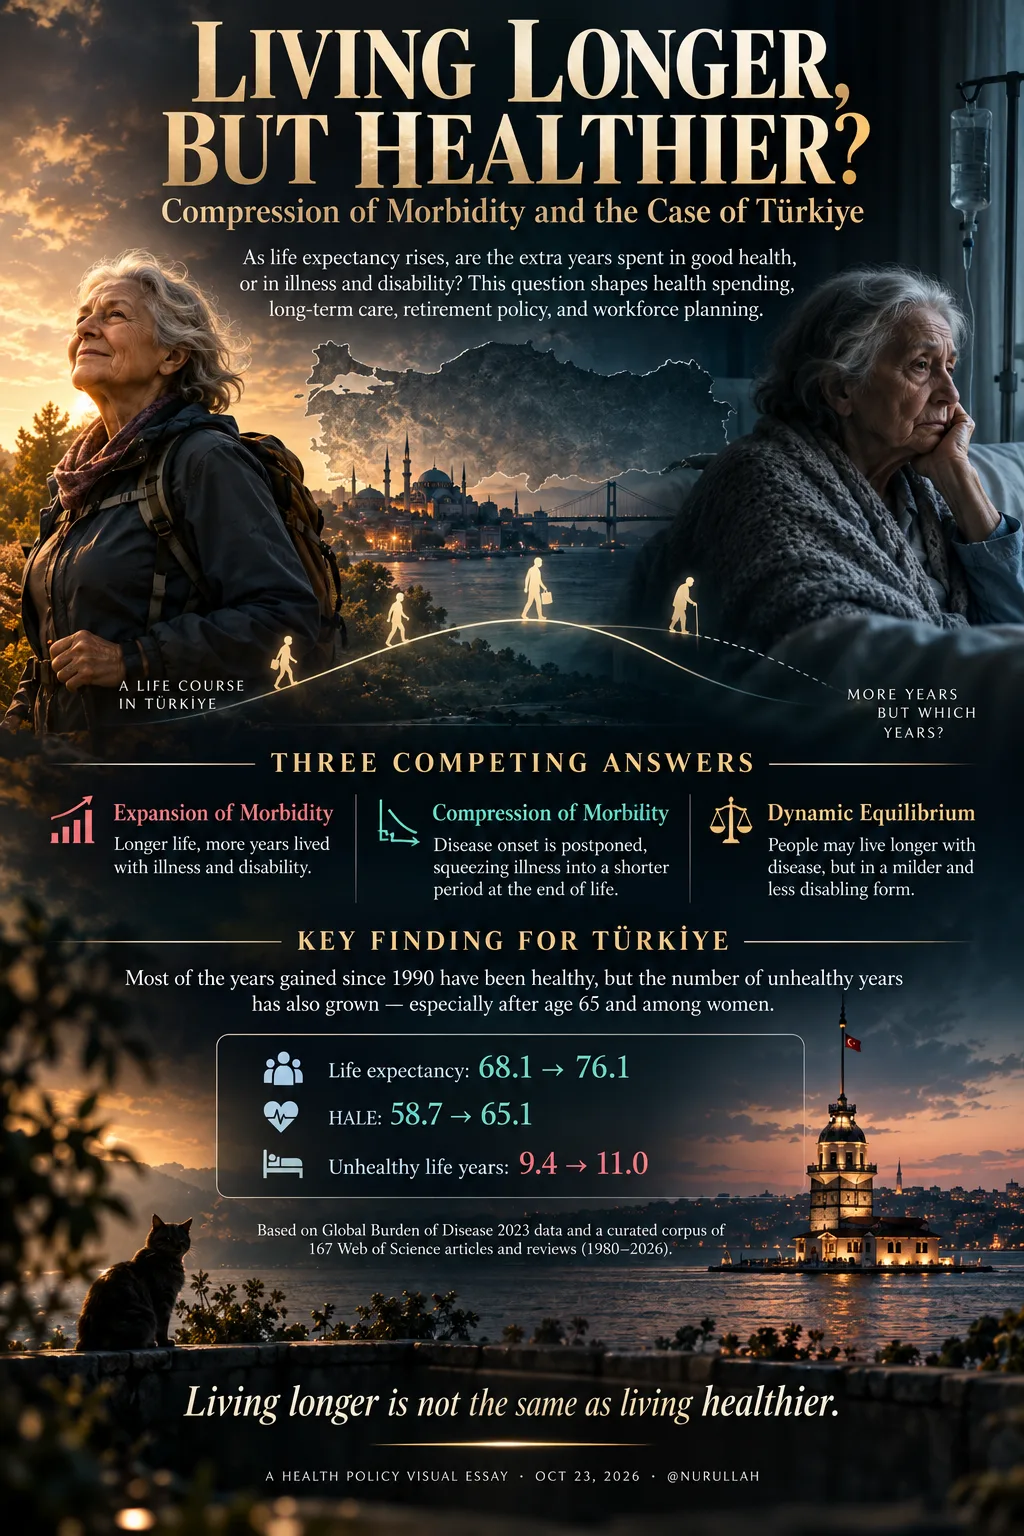
Two women both die at 85. The first manages her own life until the last two years. The second lives with diabetes, heart failure and limited mobility from the age of 70. Their lifespans are identical; their healthy lives are not.
Scale this contrast up to a whole population and you arrive at one of the most important questions in health policy today: as life expectancy rises, are the extra years spent in good health, or in illness and disability? The answer shapes health spending projections, long-term care capacity, retirement age reforms and workforce planning.
This article traces the debate from its origins in the late 1970s to the conceptual proposals of the 2020s. It explains how healthy years are measured, summarises what four decades of international evidence show, and then applies the framework to Türkiye using Global Burden of Disease 2023 data. The short answer for Türkiye: most of the years gained since 1990 have been healthy, but the number of unhealthy years has also grown, especially after age 65 and among women.
The article draws on a curated corpus of 167 journal articles and reviews indexed in Web of Science (1980-2026), complemented by recent conceptual work and national data.
Three competing answers
The debate took shape in just five years, between 1977 and 1982, and almost everything written since can be read as a test of three ideas.
Expansion of morbidity: the failures of success. In 1977, Ernest Gruenberg argued that modern medicine was succeeding at the wrong thing. Antibiotics and new treatments were preventing the fatal complications of chronic disease without curing the disease itself, so people with chronic conditions simply lived longer with them (Gruenberg, 1977). Morton Kramer (1980) extended the argument to mental disorders, warning of a coming “pandemic” of chronic disease and disability. A decade later, Olshansky and colleagues (1991) formalised the view as the expansion of morbidity hypothesis: longer life is bought at the price of worsening health.
Compression of morbidity: a fixed lifespan and postponed disease. In a landmark 1980 paper in the New England Journal of Medicine, still the most cited work in the field, James Fries offered an optimistic counter-thesis built on three propositions (Fries, 1980):
- Human lifespan has a biological limit, which Fries estimated at around 85 years on average.
- As premature deaths decline, the survival curve becomes increasingly “rectangular”, with deaths clustering near that limit.
- The onset of chronic disease can be postponed through healthier lifestyles.
If disease onset is postponed faster than death, illness is squeezed into a shorter period at the end of life. Fries later defended and refined the idea (Fries, 1983, 1989) and argued that health promotion was its main lever.
Dynamic equilibrium: more disease, but milder. Kenneth Manton (1982) proposed a middle path. Falling mortality, he argued, reflected a slowing of chronic disease progression. People might therefore live longer with disease, but in a less severe and less disabling form.
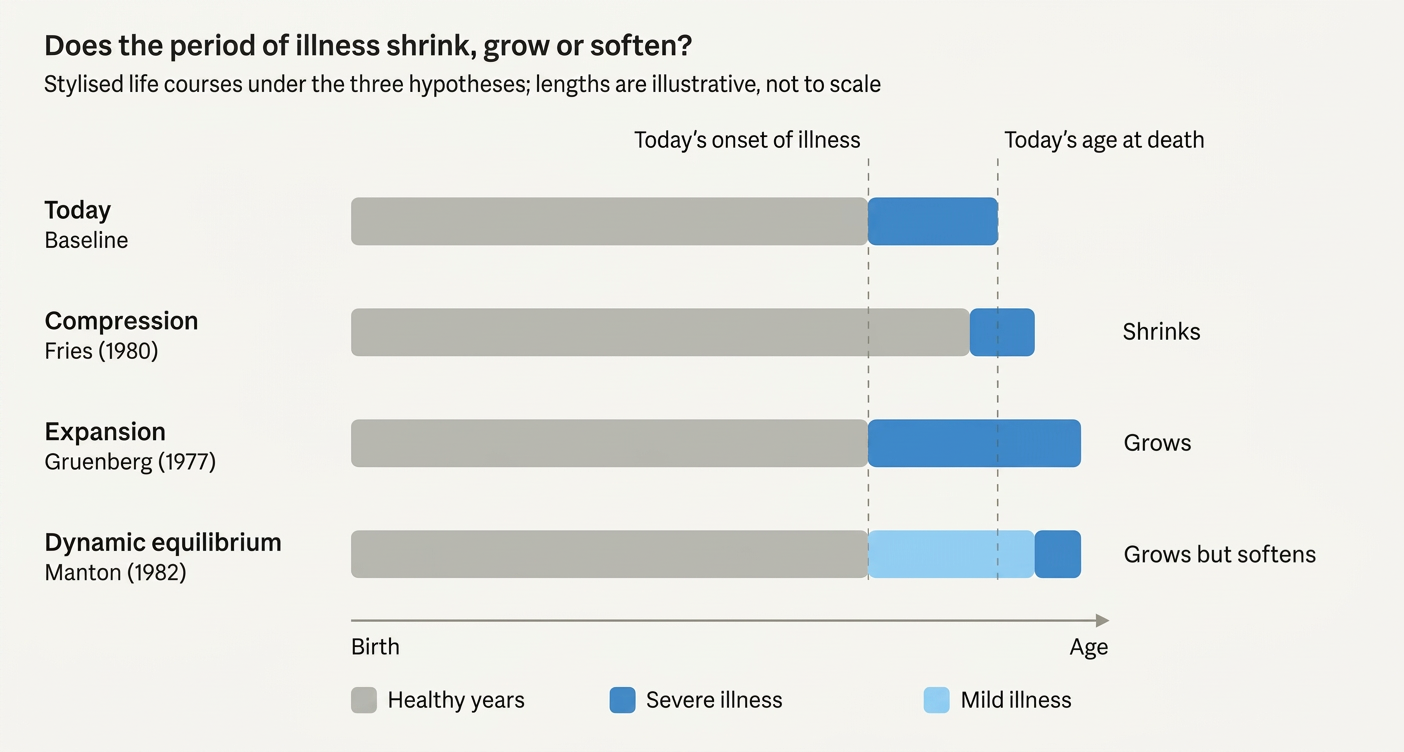
Figure 1. The three hypotheses as stylised life courses. Based on Fries (1980), Gruenberg (1977) and Manton (1982).
The three hypotheses differ less in what they predict about life expectancy than in their assumptions about why mortality falls. If death declines because disease is postponed, morbidity compresses. If it declines because fatal complications are treated, morbidity expands. If it declines because disease progresses more slowly, the result is dynamic equilibrium. Robine and Michel (2004) later argued that the three are not mutually exclusive: a population can pass through each of them in sequence as it ages.
How do we count healthy years?
Testing these hypotheses requires a measure that combines length of life with its quality. The family of measures known as health expectancy does exactly that: it splits life expectancy into years expected in good health and years expected in poor health. The difference between the two is the number of unhealthy life years, and the whole debate is about how this difference changes over time.
The main indicators
| Indicator | “Healthy” means | Typical use |
| Disability-free life expectancy (DFLE) | No limitation in daily activities | National ageing surveys |
| Healthy Life Years (HLY) | No long-standing activity limitation (the GALI question) | European Union structural indicator |
| Health-adjusted life expectancy (HALE) | Years of full health, after weighting each condition by its severity | WHO and Global Burden of Disease comparisons |
| Disease-free life expectancy | A specific disease has not yet occurred | Registry and insurance data |
The Sullivan method
Most national estimates rely on a simple and robust technique proposed by Sullivan (1971). It combines a standard life table with the age-specific prevalence of poor health from a survey: the years lived in each age group are discounted by the share of people in that group who are unhealthy. The method needs only cross-sectional data, which makes it widely comparable, but because it relies on prevalence it reacts slowly to change. Multistate life tables, which model transitions between health states and allow for recovery, address this weakness but require longitudinal panels.
Absolute versus relative change
The same data can tell two different stories. If the number of unhealthy years falls, morbidity is compressed in absolute terms. If their share of life expectancy falls, it is compressed in relative terms (Nusselder et al., 1996).
Consider a simple example. Life expectancy rises from 75 to 80 years, and unhealthy years rise from 9.0 to 9.5. The number of unhealthy years has grown, so there is absolute expansion. Yet their share has fallen from 12.0% to 11.9%, so there is also relative compression. Both headlines are true, which is why careful studies report both measures.
A sensitivity often overlooked
Health expectancy estimates are highly sensitive to methodological choices: the survey question used, the age range, and the way the health dimension is added to the life table (Luy et al., 2025). Blakely et al. (2026) add a further warning. Observed morbidity reflects not only true changes in incidence, recovery, severity and case fatality, but also changes in how well, and how broadly, disease is diagnosed. Lower diagnostic thresholds and new categories such as pre-diabetes can make morbidity appear to expand even when underlying health has not worsened.
What four decades of evidence show
The short answer is that there is no single answer. Results vary by country, by disease, by age group and, above all, by how morbidity is defined.
National trends point in different directions. In Austria, healthy life expectancy rose in both absolute and relative terms between 1978 and 1998 (Doblhammer & Kytir, 2001). In New Zealand, the share of life spent with functional limitations increased between 1981 and 1996 (Graham et al., 2004). In the United States, data for 1992-2003 showed elements of both compression and dynamic equilibrium (Cai & Lubitz, 2007), while years lived with disease and mobility loss increased between 1998 and 2008 (Crimmins & Beltrán-Sánchez, 2011). Across 31 European countries in 2005-2019, roughly a third showed compression, a third expansion and a third dynamic equilibrium (Straka et al., 2024).
The definition largely decides the verdict. A review in The Lancet found that evidence of compression was more common in high-quality, longitudinal and disability-based studies from high-income countries, while evidence of expansion was more common in studies tracking the prevalence of chronic disease (Chatterji et al., 2015). Measure disability and you are more likely to find compression; measure diagnosed disease and you are more likely to find expansion.
Diseases diverge. German insurance data show compression for stroke, lung cancer and dementia, but expansion for type 2 diabetes and multimorbidity, and a “double development” for myocardial infarction: compression among older people and expansion among the middle-aged (Geyer & Eberhard, 2022; Tetzlaff et al., 2017). In India, the median age at onset of non-communicable diseases fell from 57 to 53 years between 2004 and 2018 (Mohanty et al., 2021).
Younger generations are not necessarily healthier. Cohort studies suggest that recent birth cohorts, particularly in the United States, reach middle and older age with more chronic disease than their predecessors did at the same age (Gimeno et al., 2024; Jivraj et al., 2020).
Lifestyle compresses morbidity for individuals. Among people free of smoking, inactivity and excess weight, disability remained close to zero until 10-12 years before death (Hubert et al., 2002). Non-smokers live longer yet spend fewer years with disability in total (Nusselder et al., 2000). The very old also illustrate compression: among supercentenarians, the onset of major disease is pushed close to the end of life (Andersen et al., 2012).
Globally, absolute expansion is the norm. Across 194 countries in 1990-2016, the most common pattern was relative expansion of morbidity alongside rising life expectancy, and it was more frequent where income inequality was higher (Chen et al., 2023). Between 2000 and 2019, 84.2% of the global gain in life expectancy translated into healthy life, and the gap between life expectancy and HALE widened from 8.75 to 9.60 years (Wu et al., 2026). Across 183 countries, this gap is on average 2.4 years wider for women than for men (Garmany & Terzic, 2024).
Beyond the three hypotheses: new ideas since 2020
Recent work has shifted the question from “which hypothesis is right?” to “under what conditions, and by which measure, can we expect compression?” Five proposals stand out.
1. Look at the distribution, not just the average. Fries had stressed that variation in the age at onset of disease matters. Seaman et al. (2020) revived this point: in Denmark, the average age at first hospitalisation after 60 rose between 1987 and 2014, but its variability increased slightly. Permanyer et al. (2023) turned the idea into a global indicator, healthy lifespan inequality, which fell from 24.7 to 21.9 years worldwide between 1990 and 2019.
2. The shape of the survival curve. Yang et al. (2025) call the period spent in disease and disability the sickspan and propose a theory of when it compresses. Interventions that extend life while preserving the shape of the survival curve, such as caloric restriction, are predicted to extend the sickspan proportionally. Only interventions that make the curve steeper compress it in relative terms. Experiments in mice point the same way: life-extending dietary interventions did not compress morbidity (Thapa et al., 2026). The proposal turns Fries’s idea of rectangularisation into a testable condition.
3. The healthspan-lifespan gap. Garmany et al. (2021) proposed the gap between life expectancy and HALE as a policy target in its own right. Across 183 WHO member states, the gap widened over two decades to 9.6 years, and it was largest in the United States at 12.4 years (Garmany & Terzic, 2024).
4. From disease to function. Beard et al. (2025) measured the WHO concept of intrinsic capacity (cognitive, locomotor, sensory, psychological and vitality domains) in England and China. More recent cohorts entered older age with higher capacity, and their subsequent decline was somewhat compressed. A 68-year-old born in 1950 had higher capacity than a 62-year-old born in 1940. This helps explain a recurring paradox: diagnoses rise while function improves, which is essentially Manton’s dynamic equilibrium seen through a functional lens.
5. Separating true change from measurement change. Blakely et al. (2026) propose a framework in which observed morbidity at a given age is driven by two sets of forces. The first is epidemiological: incidence, remission, transitions between mild and severe disease, and case fatality. The second is measurement: the sensitivity and specificity of diagnosis. Their key point is that a slow drift in what counts as disease can look like a cohort effect and cannot simply be adjusted away. They recommend decomposing trends into true and artefactual components and paying close attention to the severity distribution within diseases.
None of these proposals overturns the classic hypotheses. Each one helps specify when a given hypothesis is likely to hold.
Case study: Türkiye, 1990-2023
Türkiye is a useful test case. It has experienced one of the fastest increases in life expectancy among OECD countries, yet in the Web of Science corpus reviewed for this article, not a single study focused on it. Using Global Burden of Disease 2023 estimates (IHME, 2025), the following picture emerges.
Absolute expansion, relative equilibrium at birth
Between 1990 and 2023, life expectancy at birth rose by 8.0 years (from 68.1 to 76.1) and HALE by 6.4 years (from 58.7 to 65.1). Unhealthy life years therefore increased from 9.4 to 11.0. Their share of life expectancy, however, barely moved: 13.8% in 1990, 13.9% in 2019 and 14.4% in 2023, with the last rise coinciding with the COVID-19 pandemic and the 2023 earthquakes.
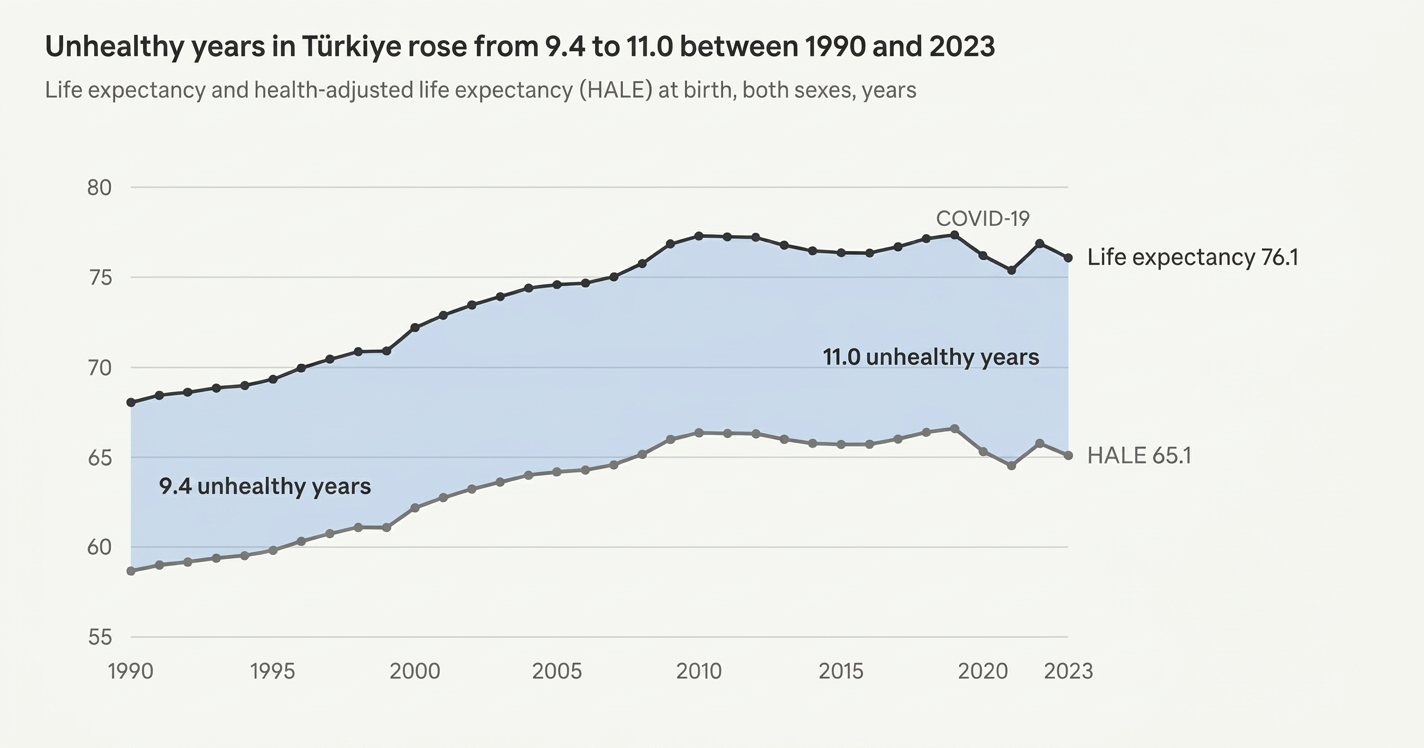
Figure 2. Life expectancy and HALE at birth, Türkiye, 1990-2023. Data: IHME, GBD 2023.
In the vocabulary of the debate, Türkiye shows absolute expansion with approximate relative equilibrium at birth.
Expansion is sharper in later life
The picture is less favourable at age 65. Remaining life expectancy grew by 2.4 years (from 14.6 to 17.0), but only 1.6 of those years were healthy. Unhealthy years at 65 rose from 3.8 to 4.7, and their share from 26.3% to 27.5%, which means both absolute and relative expansion in later life. Women are more affected: in 2023, a 65-year-old woman could expect 5.3 unhealthy years (28.7% of her remaining life), compared with 4.0 years (26.0%) for a man.
The mechanism: stable morbidity, falling mortality
The all-cause age-standardised rate of years lived with disability (YLD) did not change significantly over three decades (-2.2%; 95% uncertainty interval -8.5 to 5.0), while the total number of YLDs rose by 80% as the population grew and aged. This is exactly the arithmetic Blakely et al. (2026) describe: when mortality falls but age-specific morbidity does not, morbidity expands.
Beneath the stable total, the composition of morbidity shifted. Conditions linked to development, such as dietary iron deficiency and unintentional injuries, declined. Chronic and mental conditions grew: diabetes rose by 70.1%, depressive disorders by 41.6%, other musculoskeletal disorders by 29.3% and falls by 15.6%.
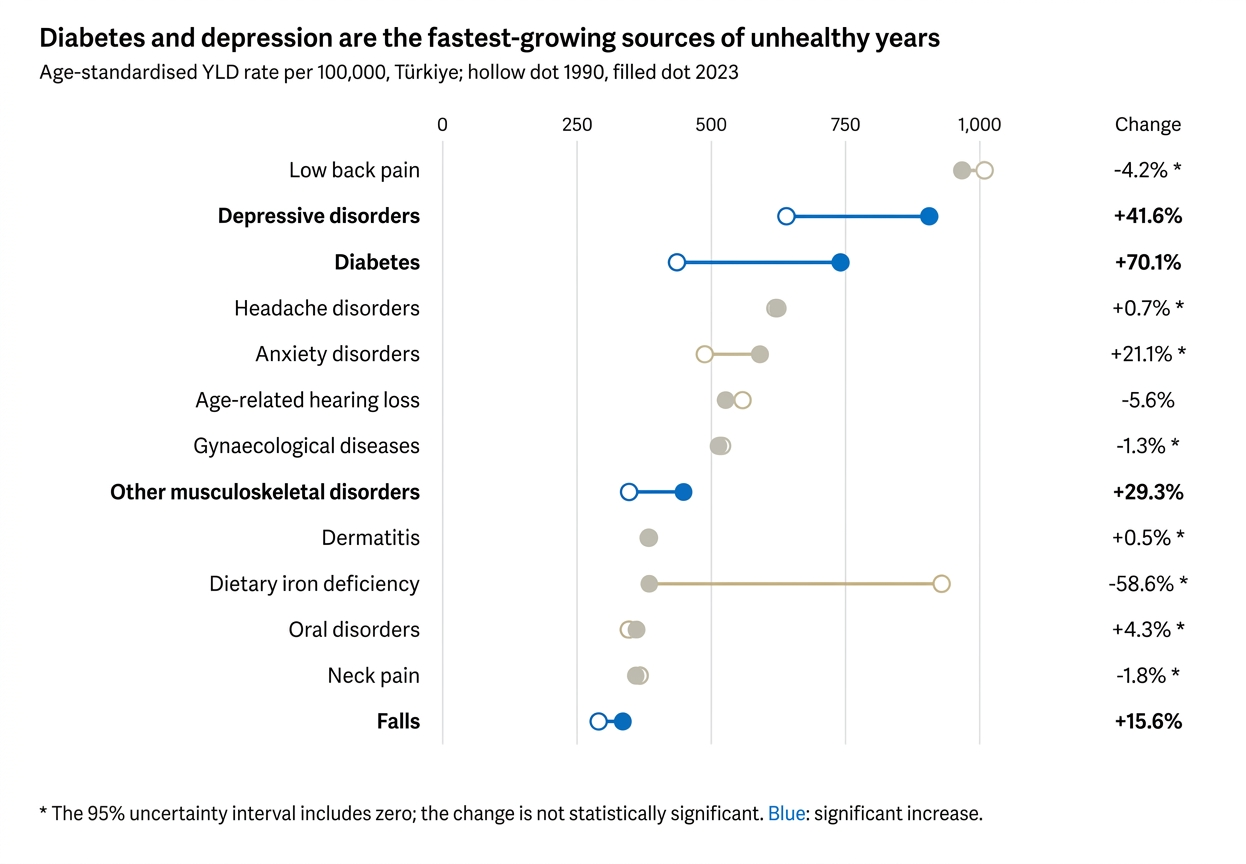
Figure 3. Change in age-standardised YLD rates by cause, Türkiye, 1990-2023. Percent changes are those published by GBD. Data: IHME, GBD 2023.
Among people aged 70 and over, five causes account for about 40% of all YLDs: age-related hearing loss (10.4%), diabetes (9.4%), low back pain (8.8%), Alzheimer’s disease and other dementias (6.1%), and blindness and vision loss (5.4%).
Low level, high conversion
Internationally, Türkiye presents a paradox. It ranks 37th among 38 OECD countries for life expectancy and 36th for HALE in 2023. Yet it converted 79.8% of its 1990-2023 life expectancy gain into healthy life, the fourth highest share in the OECD (median 69.4%). At the other end, the United States converted only 32.8%.
| Country | Life expectancy | HALE | Unhealthy years | Share (%) |
| OECD median | 81.7 | 69.2 | 12.1 | 14.8 |
| Greece | 81.0 | 69.1 | 11.9 | 14.7 |
| Iran | 78.8 | 66.3 | 12.5 | 15.9 |
| Türkiye | 76.1 | 65.1 | 11.0 | 14.4 |
| Bulgaria | 75.9 | 65.6 | 10.3 | 13.5 |
| Georgia | 74.7 | 64.3 | 10.4 | 14.0 |
Values at birth, both sexes, 2023. Data: IHME, GBD 2023.
Two cautions apply. First, the number of unhealthy years naturally rises with life expectancy, because more people reach the ages at which chronic disease concentrates; the share is a fairer basis for comparison. Second, a high conversion share in countries that started from a lower life expectancy may partly reflect gains at younger ages, which are mostly healthy. This is a hypothesis that an age decomposition would need to test.
Why definitions matter: two answers for one country
How many years can a newborn in Türkiye expect to live in poor health? According to the Turkish Statistical Institute (TurkStat), about 20.5 years. According to GBD 2023, 11.0 years.
| Source (period) | Life expectancy | Healthy life expectancy | Unhealthy years | Share (%) |
| TurkStat (2023-2025) | 78.5 | 58.0 | 20.5 | 26.1 |
| TurkStat (2016-2018) | 78.3 | 58.3 | 20.0 | 25.5 |
| GBD (2023) | 76.1 | 65.1 | 11.0 | 14.4 |
| GBD (2017) | 76.7 | 66.0 | 10.7 | 13.9 |
Values at birth, both sexes. Sources: TurkStat life table bulletins (2019, 2026); IHME (2025).
The gap is not an error but a difference in definition. TurkStat bases its estimate on the activity limitation question in its Income and Living Conditions Survey, so any health problem that limits daily activities counts the whole year as unhealthy. GBD weights each condition by its severity, so a mild condition removes only a small fraction of a healthy year. A third, model-based national estimate gives yet another level (Bingöl & Beyazit, 2021).
The two sources also differ on sex. In TurkStat data, women’s healthy life expectancy is lower than men’s (56.9 versus 59.1 years in 2023-2025); in GBD, women’s HALE is slightly higher (65.5 versus 64.7 years in 2023). Both agree, however, that women spend more years in poor health.
Most importantly, the two sources agree on the direction of change: unhealthy years rose by 0.5 years in the TurkStat series between 2016-2018 and 2023-2025, and by 0.3 years in GBD between 2017 and 2023. The lesson echoes Luy et al. (2025): the verdict on compression or expansion should be sought in trends measured with one consistent definition, not in levels compared across sources.
What this means for health managers and policymakers
The compression debate is not an academic curiosity. Which scenario materialises determines health budgets, care capacity and the sustainability of pension systems.
Ageing cost projections need morbidity scenarios. In the United Kingdom, models that ignored compression or expansion produced annual cost increases from ageing ranging between 0.48% and 1.12% (Caley & Sidhu, 2011). In the Netherlands, compression generally produced the lowest growth in expenditure (Wouterse et al., 2015). In Austria, per-capita health costs were projected to rise by 26% under morbidity expansion, but could fall by 5% if healthy life years grew and socioeconomic gaps narrowed (Horvath et al., 2025). Population projections alone are not enough; planning should include sensitivity analysis under at least two morbidity scenarios.
Retirement policy rests on a hidden assumption. Linking pension age to life expectancy assumes that the added years are healthy enough to work. In Germany, healthy working life expectancy has risen, but so have years spent in the labour force in poor health (Heller et al., 2022), and years without musculoskeletal disease have not kept pace with the extension of working life (Tetzlaff et al., 2024). If morbidity expands, higher retirement ages place the heaviest burden on workers in poor health.
Each hypothesis implies a different service model.
- If morbidity is compressing, the priority is primary prevention and health promotion, along with palliative capacity for a shorter but intensive period of care at the end of life.
- If it is expanding, long-term care, home care and multimorbidity management become central, and the burden on family carers grows.
- If it is in dynamic equilibrium, early diagnosis and slowing disease progression are the key strategies, with chronic disease management in primary care at the core.
For Türkiye, four priorities follow from the evidence.
- Prevent metabolic disease. A 70% rise in diabetes-related disability calls for stronger obesity and diabetes screening and lifestyle interventions in primary care.
- Plan mental health services for an ageing population. The 42% rise in depression-related disability requires community-based mental health services that reach older adults.
- Invest in function in later life. Hearing aids, cataract surgery, fall prevention and rehabilitation can limit functional loss even when chronic disease persists, which is dynamic equilibrium as a policy goal.
- Monitor healthy life expectancy as a national performance indicator. Use one consistent definition, state it clearly, and disaggregate by sex, education and region.
The bottom line
Living longer is an achievement; living longer in good health is the goal. Four decades of research show that compression of morbidity is possible but not automatic. It depends on prevention, on equity and on the services that protect function in later life. Türkiye has done well at turning longer lives into healthy lives so far. The next challenge is to keep doing so as its population grows older and chronic disease becomes the main source of ill health.
References
Andersen, S. L., Sebastiani, P., Dworkis, D. A., Feldman, L., & Perls, T. T. (2012). Health span approximates life span among many supercentenarians: Compression of morbidity at the approximate limit of life span. The Journals of Gerontology: Series A, 67(4), 395–405. https://doi.org/10.1093/gerona/glr223
Beard, J. R., Hanewald, K., Si, Y., Amuthavalli Thiyagarajan, J., & Moreno-Agostino, D. (2025). Cohort trends in intrinsic capacity in England and China. Nature Aging, 5(1), 87–98. https://doi.org/10.1038/s43587-024-00741-w
Bingöl, Ş., & Beyazit, İ. (2021). 1920-2019 yılları arası Türkiye için kurulan hayat tabloları kullanılarak sağlıklı yaşam yılı beklentisinin ve kaybedilen sağlıklı yaşam yıllarının hesaplanması [Calculation of healthy life expectancy and healthy life years lost by using the life tables for Turkey between 1920-2019]. Nüfusbilim Dergisi, 43, 30–60.
Blakely, T., Demsiss, W., & Ramsay, D. (2026). Is morbidity expanding? An epidemiological framework for understanding morbidity expansion and multimorbidity [Commentary]. International Journal of Epidemiology, 55(3). https://doi.org/10.1093/ije/dyag037
Cai, L., & Lubitz, J. (2007). Was there compression of disability for older Americans from 1992 to 2003? Demography, 44(3), 479–495. https://doi.org/10.1353/dem.2007.0022
Caley, M., & Sidhu, K. (2011). Estimating the future healthcare costs of an aging population in the UK: Expansion of morbidity and the need for preventative care. Journal of Public Health, 33(1), 117–122. https://doi.org/10.1093/pubmed/fdq044
Chatterji, S., Byles, J., Cutler, D., Seeman, T., & Verdes, E. (2015). Health, functioning, and disability in older adults: Present status and future implications. The Lancet, 385(9967), 563–575. https://doi.org/10.1016/S0140-6736(14)61462-8
Chen, H., Ning, J., Hu, H., & He, H. (2023). Distribution of the compression and expansion of morbidity in 194 countries and territories, 1990–2016: The role of income inequality. Sociology of Health & Illness, 45(7), 1523–1540. https://doi.org/10.1111/1467-9566.13645
Crimmins, E. M., & Beltrán-Sánchez, H. (2011). Mortality and morbidity trends: Is there compression of morbidity? The Journals of Gerontology: Series B, 66(1), 75–86. https://doi.org/10.1093/geronb/gbq088
Doblhammer, G., & Kytir, J. (2001). Compression or expansion of morbidity? Trends in healthy-life expectancy in the elderly Austrian population between 1978 and 1998. Social Science & Medicine, 52(3), 385–391. https://doi.org/10.1016/S0277-9536(00)00141-6
Fries, J. F. (1980). Aging, natural death, and the compression of morbidity. The New England Journal of Medicine, 303(3), 130–135. https://doi.org/10.1056/NEJM198007173030304
Fries, J. F. (1983). The compression of morbidity. The Milbank Memorial Fund Quarterly: Health and Society, 61(3), 397–419. https://doi.org/10.2307/3349864
Fries, J. F. (1989). The compression of morbidity: Near or far? The Milbank Quarterly, 67(2), 208–232. https://doi.org/10.2307/3350138
Garmany, A., & Terzic, A. (2024). Global healthspan-lifespan gaps among 183 World Health Organization member states. JAMA Network Open, 7(12), Article e2450241. https://doi.org/10.1001/jamanetworkopen.2024.50241
Garmany, A., Yamada, S., & Terzic, A. (2021). Longevity leap: Mind the healthspan gap. npj Regenerative Medicine, 6(1), Article 57. https://doi.org/10.1038/s41536-021-00169-5
Geyer, S., & Eberhard, S. (2022). Compression and expansion of morbidity. Deutsches Ärzteblatt International, 119(47), 810–815. https://doi.org/10.3238/arztebl.m2022.0324
Gimeno, L., Goisis, A., Dowd, J. B., & Ploubidis, G. B. (2024). Cohort differences in physical health and disability in the United States and Europe. The Journals of Gerontology: Series B, 79(8), Article gbae113. https://doi.org/10.1093/geronb/gbae113
Graham, P., Blakely, T., Davis, P., Sporle, A., & Pearce, N. (2004). Compression, expansion, or dynamic equilibrium? The evolution of health expectancy in New Zealand. Journal of Epidemiology and Community Health, 58(8), 659–666. https://doi.org/10.1136/jech.2003.014910
Gruenberg, E. M. (1977). The failures of success. The Milbank Memorial Fund Quarterly: Health and Society, 55(1), 3–24.
Heller, C., Sperlich, S., Tetzlaff, F., Geyer, S., Epping, J., Beller, J., & Tetzlaff, J. (2022). Living longer, working longer: Analysing time trends in working life expectancy in Germany from a health perspective between 2002 and 2018. European Journal of Ageing, 19(4), 1263–1276. https://doi.org/10.1007/s10433-022-00707-0
Horvath, T., Leoni, T., Reschenhofer, P., & Spielauer, M. (2025). The impact of ageing, socio-economic differences and the evolution of morbidity on future health expenditure: A dynamic microsimulation. BMC Health Services Research, 25(1), Article 952. https://doi.org/10.1186/s12913-025-13072-2
Hubert, H. B., Bloch, D. A., Oehlert, J. W., & Fries, J. F. (2002). Lifestyle habits and compression of morbidity. The Journals of Gerontology: Series A, 57(6), M347–M351. https://doi.org/10.1093/gerona/57.6.M347
Institute for Health Metrics and Evaluation. (2025). Global Burden of Disease Study 2023 (GBD 2023) results [Data set]. University of Washington. https://vizhub.healthdata.org/gbd-results/
Jivraj, S., Goodman, A., Pongiglione, B., & Ploubidis, G. B. (2020). Living longer but not necessarily healthier: The joint progress of health and mortality in the working-age population of England. Population Studies, 74(3), 399–414. https://doi.org/10.1080/00324728.2020.1767297
Kramer, M. (1980). The rising pandemic of mental disorders and associated chronic diseases and disabilities. Acta Psychiatrica Scandinavica, 62(Suppl. 285), 382–397.
Luy, M., Di Giulio, P., di Lego, V., Lazarevic, P., Muszynska-Spielauer, M., & Sauerberg, M. (2025). Health expectancy: Increasingly used, but not well understood. Comparative Population Studies, 50, 239–264. https://doi.org/10.12765/CPoS-2025-14
Manton, K. G. (1982). Changing concepts of morbidity and mortality in the elderly population. The Milbank Memorial Fund Quarterly: Health and Society, 60(2), 183–244.
Mohanty, S. K., Rodgers, J., Singh, R. R., Mishra, R. S., Kim, R., Khan, J., Behera, P., & Subramanian, S. V. (2021). Morbidity compression or expansion? A temporal analysis of the age at onset of non-communicable diseases in India. GeroScience, 43(1), 409–422. https://doi.org/10.1007/s11357-020-00296-9
Nusselder, W. J., Looman, C. W. N., van de Mheen, P. J. M., van de Mheen, H., & Mackenbach, J. P. (2000). Smoking and the compression of morbidity. Journal of Epidemiology and Community Health, 54(8), 566–574. https://doi.org/10.1136/jech.54.8.566
Nusselder, W. J., van der Velden, K., van Sonsbeek, J. L. A., Lenior, M. E., & van den Bos, G. A. M. (1996). The elimination of selected chronic diseases in a population: The compression and expansion of morbidity. American Journal of Public Health, 86(2), 187–194. https://doi.org/10.2105/AJPH.86.2.187
Olshansky, S. J., Rudberg, M. A., Carnes, B. A., Cassel, C. K., & Brody, J. A. (1991). Trading off longer life for worsening health: The expansion of morbidity hypothesis. Journal of Aging and Health, 3(2), 194–216.
Permanyer, I., Villavicencio, F., & Trias-Llimós, S. (2023). Healthy lifespan inequality: Morbidity compression from a global perspective. European Journal of Epidemiology, 38(5), 511–521. https://doi.org/10.1007/s10654-023-00989-3
Robine, J.-M., & Michel, J.-P. (2004). Looking forward to a general theory on population aging. The Journals of Gerontology: Series A, 59(6), M590–M597. https://doi.org/10.1093/gerona/59.6.M590
Seaman, R., Höhn, A., Lindahl-Jacobsen, R., Martikainen, P., van Raalte, A., & Christensen, K. (2020). Rethinking morbidity compression. European Journal of Epidemiology, 35(5), 381–388. https://doi.org/10.1007/s10654-020-00642-3
Straka, J., Šidlo, L., & Kulhánová, I. (2024). Trends in healthy life years between 2005 and 2019 in 31 European countries: The compression or expansion of morbidity? International Journal of Public Health, 69, Article 1607574. https://doi.org/10.3389/ijph.2024.1607574
Sullivan, D. F. (1971). A single index of mortality and morbidity. HSMHA Health Reports, 86(4), 347–354.
Tetzlaff, J., Epping, J., Stahmeyer, J. T., Liebers, F., Hegewald, J., Sperlich, S., Beller, J., & Tetzlaff, F. (2024). The development of working life expectancy without musculoskeletal diseases against the backdrop of extended working lives. Scientific Reports, 14, Article 7930. https://doi.org/10.1038/s41598-024-58650-2
Tetzlaff, J., Muschik, D., Epping, J., Eberhard, S., & Geyer, S. (2017). Expansion or compression of multimorbidity? 10-year development of life years spent in multimorbidity based on health insurance claims data of Lower Saxony, Germany. International Journal of Public Health, 62(6), 679–686. https://doi.org/10.1007/s00038-017-0962-9
Thapa, D. K., Najam, W., Parker, E. S., Smith, D. L., Beyaztas, U., Nelson, J. F., Austad, S. N., Churchill, G. A., & Allison, D. B. (2026). Life-extending interventions do not necessarily result in compression of morbidity: A case example offering a robust statistical approach. GeroScience, 48(1), 263–281. https://doi.org/10.1007/s11357-025-01925-x
Turkish Statistical Institute. (2019). Life tables, 2016-2018 [Press release]. TurkStat.
Turkish Statistical Institute. (2026, July 29). Life tables, 2023-2025 [Press release]. TurkStat.
Wouterse, B., Huisman, M., Meijboom, B. R., Deeg, D. J. H., & Polder, J. J. (2015). The effect of trends in health and longevity on health services use by older adults. BMC Health Services Research, 15, Article 574. https://doi.org/10.1186/s12913-015-1239-8
Wu, Y., Lai, L., & Lee, H. L. (2026). Survival gains and healthy life expectancy across 185 countries: A global ageing surveillance study, 2000–2021. Archives of Gerontology and Geriatrics, 150, Article 106362. https://doi.org/10.1016/j.archger.2026.106362
Yang, Y., Mayo, A., Levy, T., Raz, N., Shenhar, B., Jarosz, D. F., & Alon, U. (2025). Compression of morbidity by interventions that steepen the survival curve. Nature Communications, 16(1), Article 3340. https://doi.org/10.1038/s41467-025-57807-5